

A popular brand of cat food is famous for its claim that 8 out of 10 cat owners said their cats prefer it. But who are the cat owners? Which cats liked this brand?
If only life was as straightforward as these type of figures might at first suggest. The real world is more complex and uneven that it first seems.
From cases of disease to levels of unemployment, exam results to cat food preferences, how things are spread out is as important as the number of times they might happen.
Average
Cases are rarely spread evenly. In few cases do they conform to the average. Simple statistics make for good headlines but the reality is as always far less clear cut.
To work what such numbers mean and what it might be necessary to do as a result we need to understand both
- how these cases are distributed and
- what factors that affect that distribution or spread.
To see how you can read more accurate meaning into these types of statistics and apply to real life, let's take a look at something we have all grown very familiar with in the last two years: health statistics.
Sample
Every week the Office for National Statistics (ONS) take a random sample of households and test them for Covid.
On the basis of this sample and the results it produces they work out the likely number of cases in the wider population.
Only the reality is far less straightforward than the simple 1 in whatever figure.
This estimation is itself based on a set of assumptions and so not only has a margin of error within it but - as we have seen in a previous blog - the possibility that one or more of the assumptions are inaccurate.
Spread
Let’s take some recent data.
On Friday 8th October ONS’s latest release indicated an occurrence of 1 in 70 people in England, an increase on the previous week.
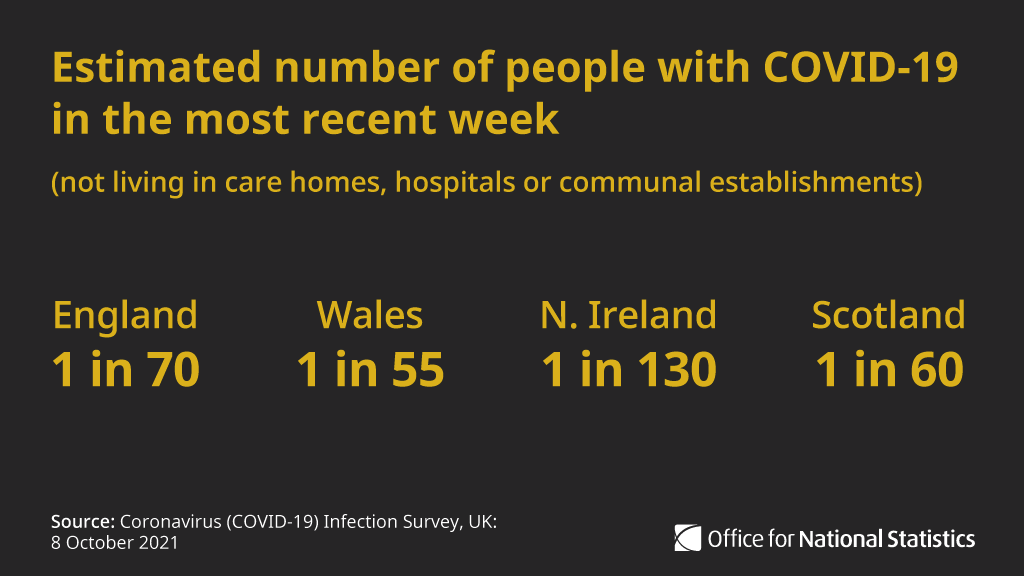
Whilst concerning and an attention grabbing headline, this figure hides what is really going on in the wider population.
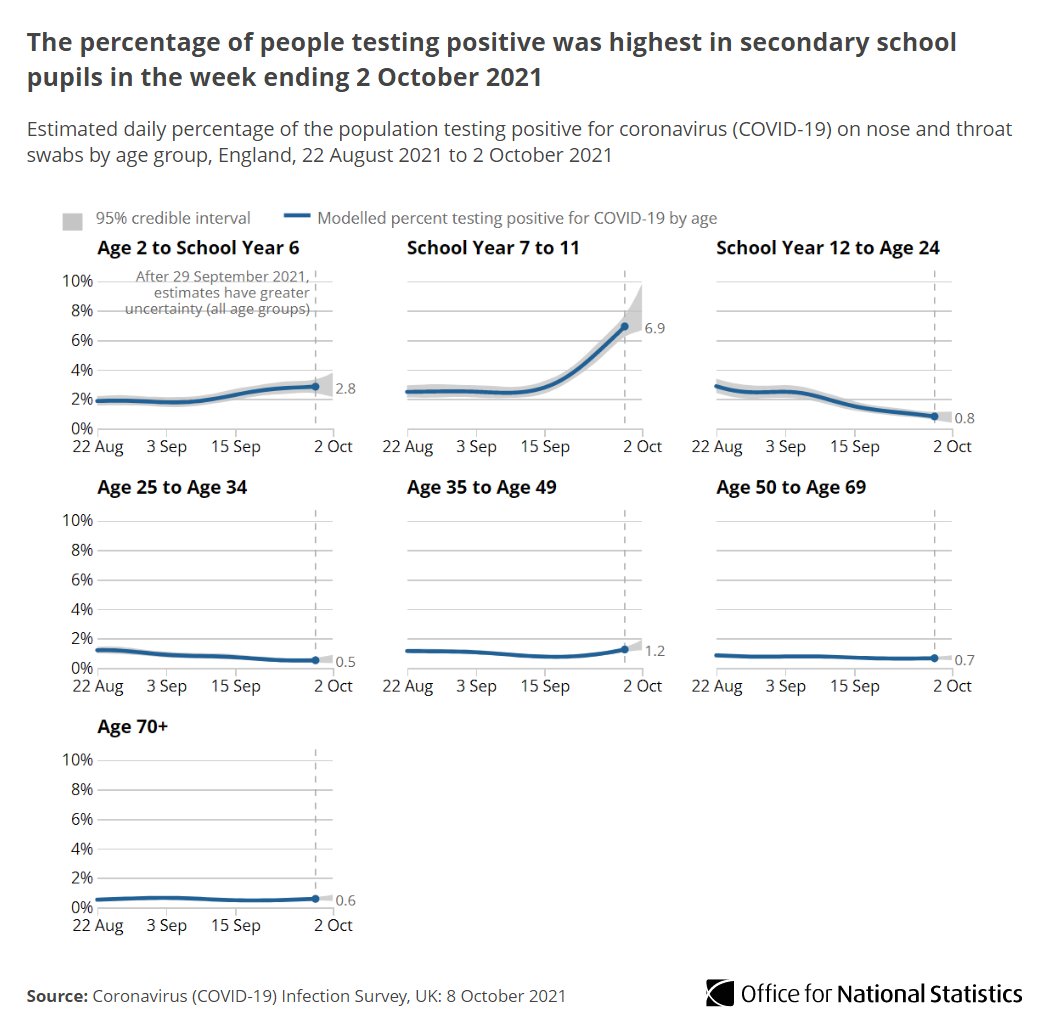
The further analysis ONS published highlighted the how the incidence of COVID was much greater in younger age groups than older ones.
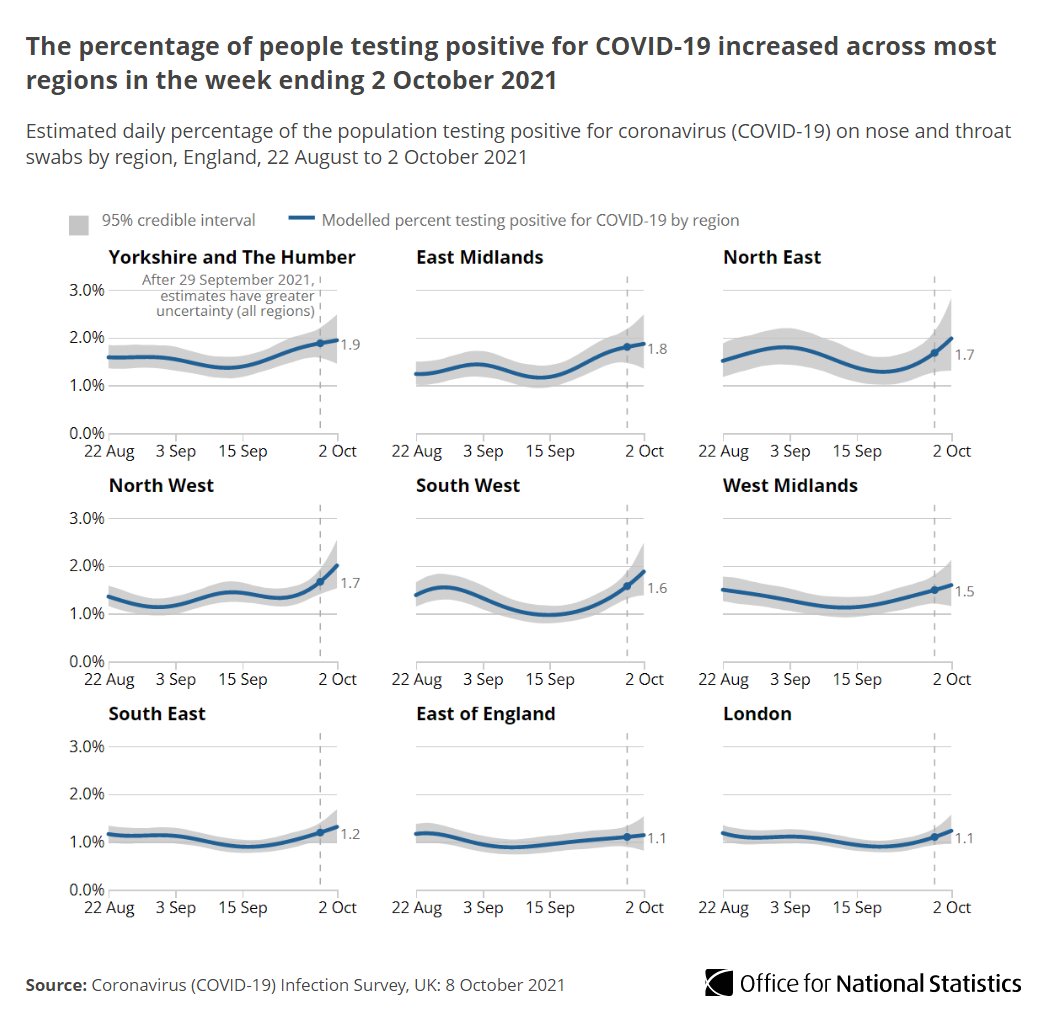
Nor were the cases of Covid evenly distributed geographically throughout England with some regions and towns seeing significantly greater case loads.
Therefore, where the immediate focus of concern is on the average of 1 in 70 people who are a potential risk to others, the finer analysis highlights how distribution of these cases creates peaks of risk in certain age groups, in certain places and therefore concentrates risk within more specific contexts.
Insight
So what does this example show us and what can you learn that will help you understand such numbers better?
First, average figures - in this case a mean1 of all cases within the population - are a useful starting point for analysis but should never be treated as the final result.
Second, cases are distributed unevenly within the population. Whilst a random sample provides an initial gauge of frequency of cases it is less insightful about the contexts for them. It is a useful illustration of why further analysis might require a stratified random sample to examine cases according to their distribution and understand more about the influencing factors.
But thirdly it begins to point towards, identify and confirm the factors that are the reason for this distribution. With Covid these include things such as vaccination status, age and health conditions. Knowing what the “risk” factors are behind the uneven distribution is the insight that is required to design ways to address their incidence.
Thankfully, ONS recognise these elements in their final conclusions. Yet the problem remains that media headlines and political reaction is often based solely on the headline.
So next time you see a headline figure describing a large population, before jumping to equally average conclusions ask yourself how evenly those cases are distributed within that group or population and then what the factors are or might be that make the spread less even.
1 The mean is the most commonly used statistic in describing an average. It is calculated by taking the total/sum of the number of cases observed and dividing it by the wider population. In this example it is the number of covid cases divided by the population of the country/region/local authority area.
You may also be interested in


Thought, inspiration and how-to straight in your inbox - Sign up today
By subscribing you will receive our newsletter up to 4 times a year and occasional news of forthcoming events. You can unsubscribe at anytime.