
We are surrounded by information and data all the time. Some say bombarded. Our phones are always switched on. Notifications ping with news and views. We can find out where our bus or train is to the nearest second.
But how much of this real time data do we need? Can we ever have too much information? Or does having too much get in the way of us working out our what is going on?
Knowing the score
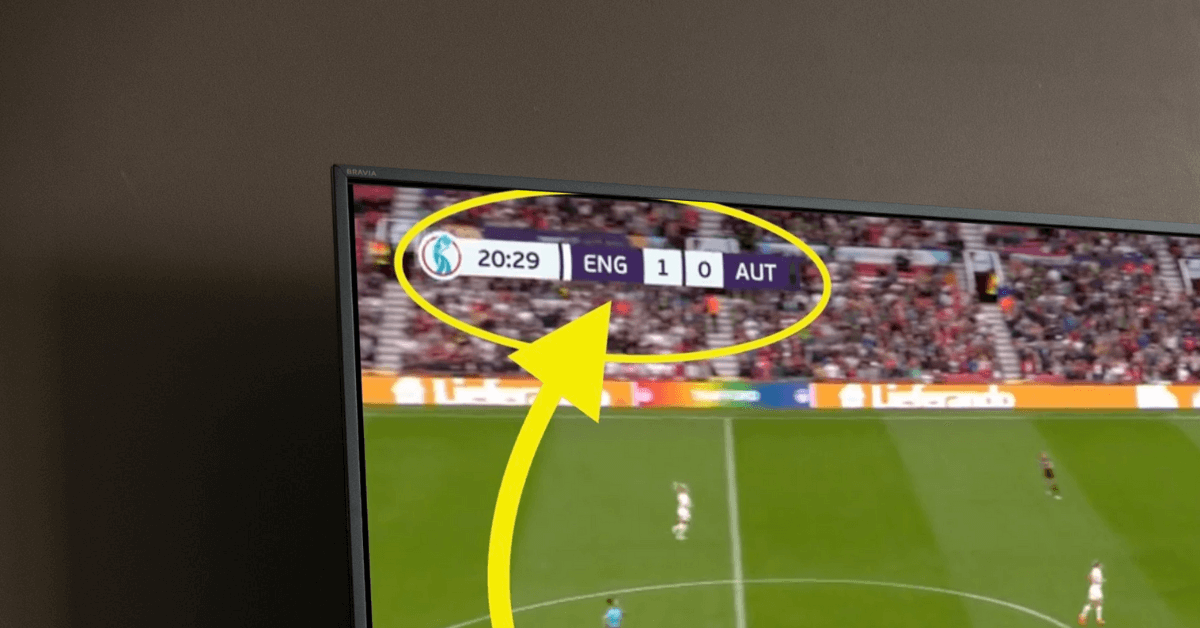
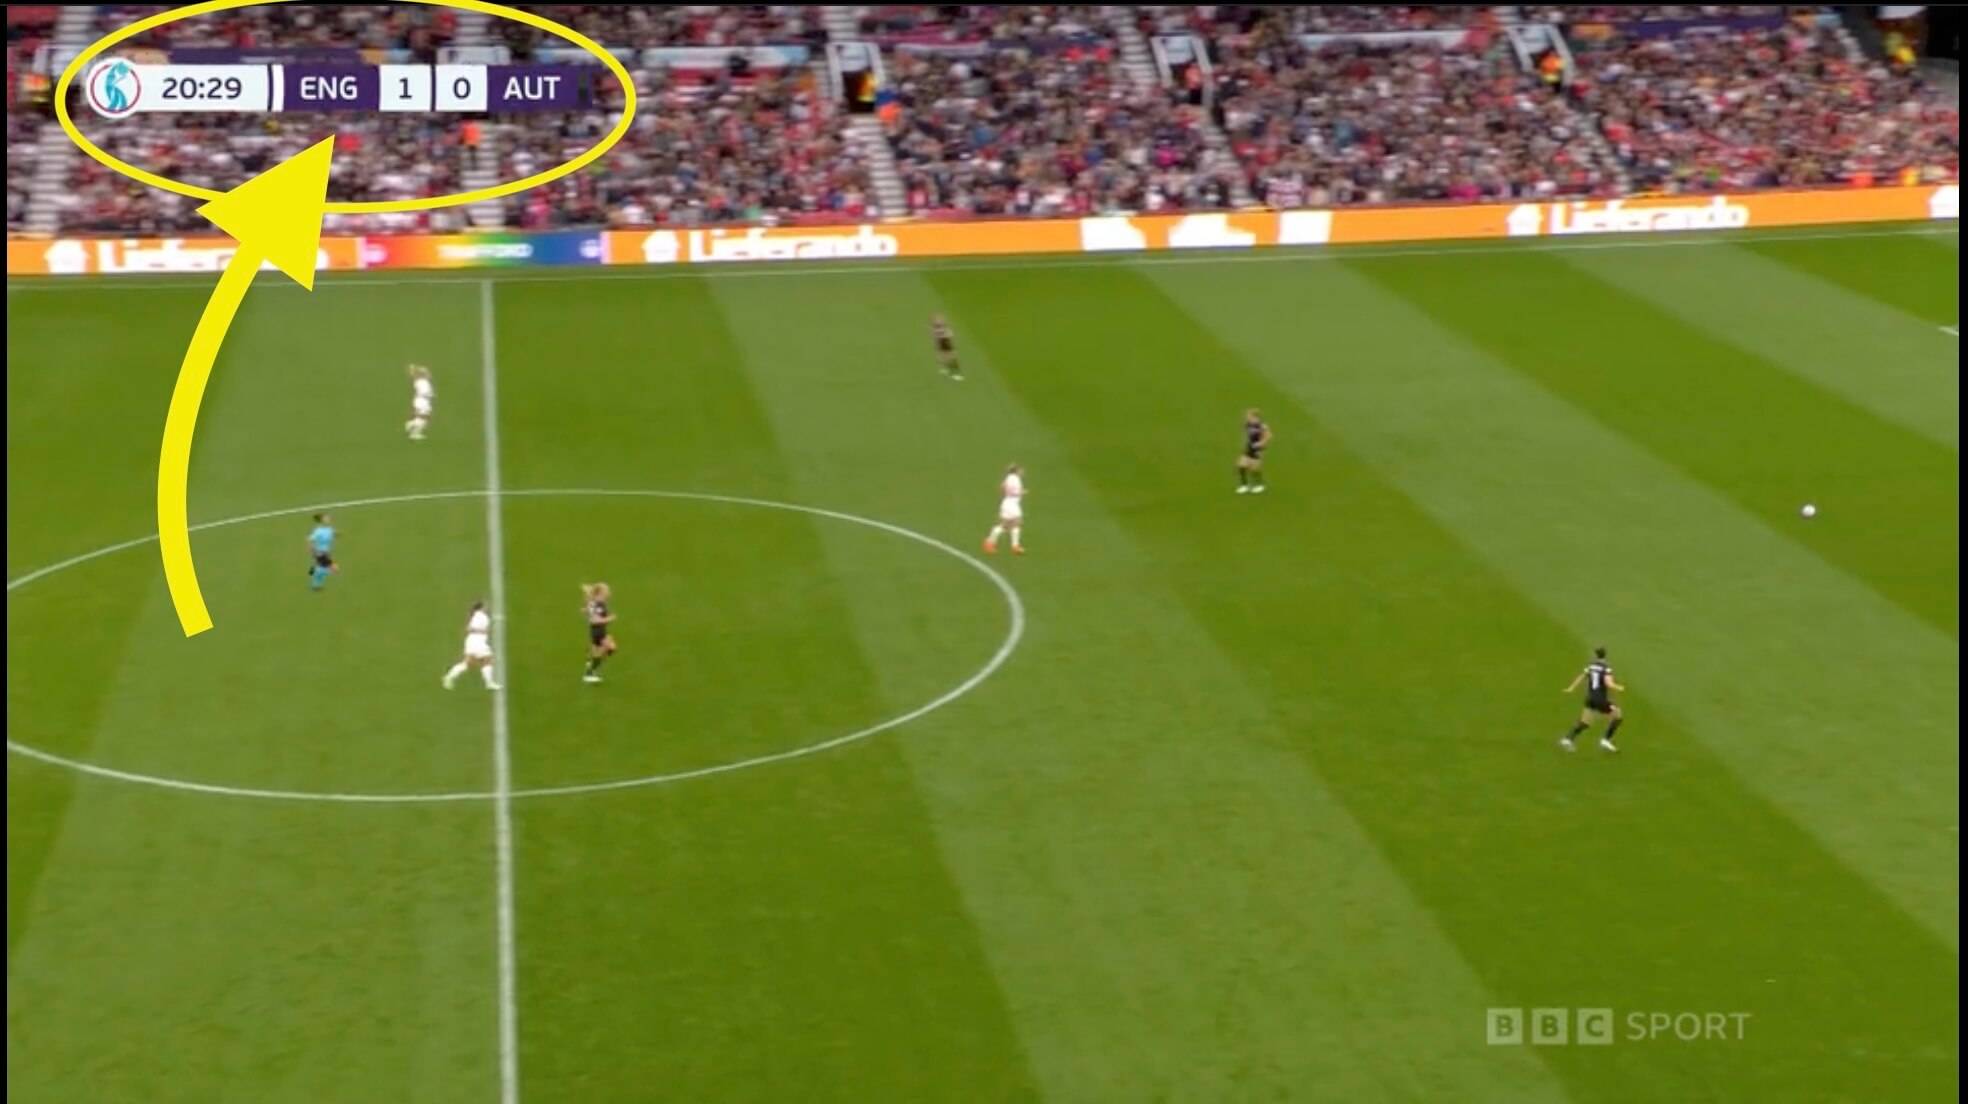
Imagine watching a football match and not knowing the score. It’s difficult to know what is going on if you are just tuning in.
We have become used to the tiny on-screen graphic providing this vital piece of data. Yet we dealt without it in the past If you’re in the car - or just enjoying the aural sensation of sports commentary - on the radio, there is no real time graphic to inform you. But for many armchair fans such a scenario is now very hard to comprehend.
Football coverage also provides lots of real time data to illustrate the state of play in a match. Possession percentage, shots made, shots in target. They each help shape the viewers understanding of what is going on, who has the upper hand and the opportunities missed.
And maybe football is a better sporting spectacle for it. Real time data enhancing the real time analysis even for the amateur.
Congestion ahead
But let’s take another sport: cycling.
Like football it is familiar to spot real time data during a race. Importantly there’s the distance to the finish and any time gaps between riders or groups of riders on the road, e.g. between a break away and the peloton or importantly a challenger and a race leader.
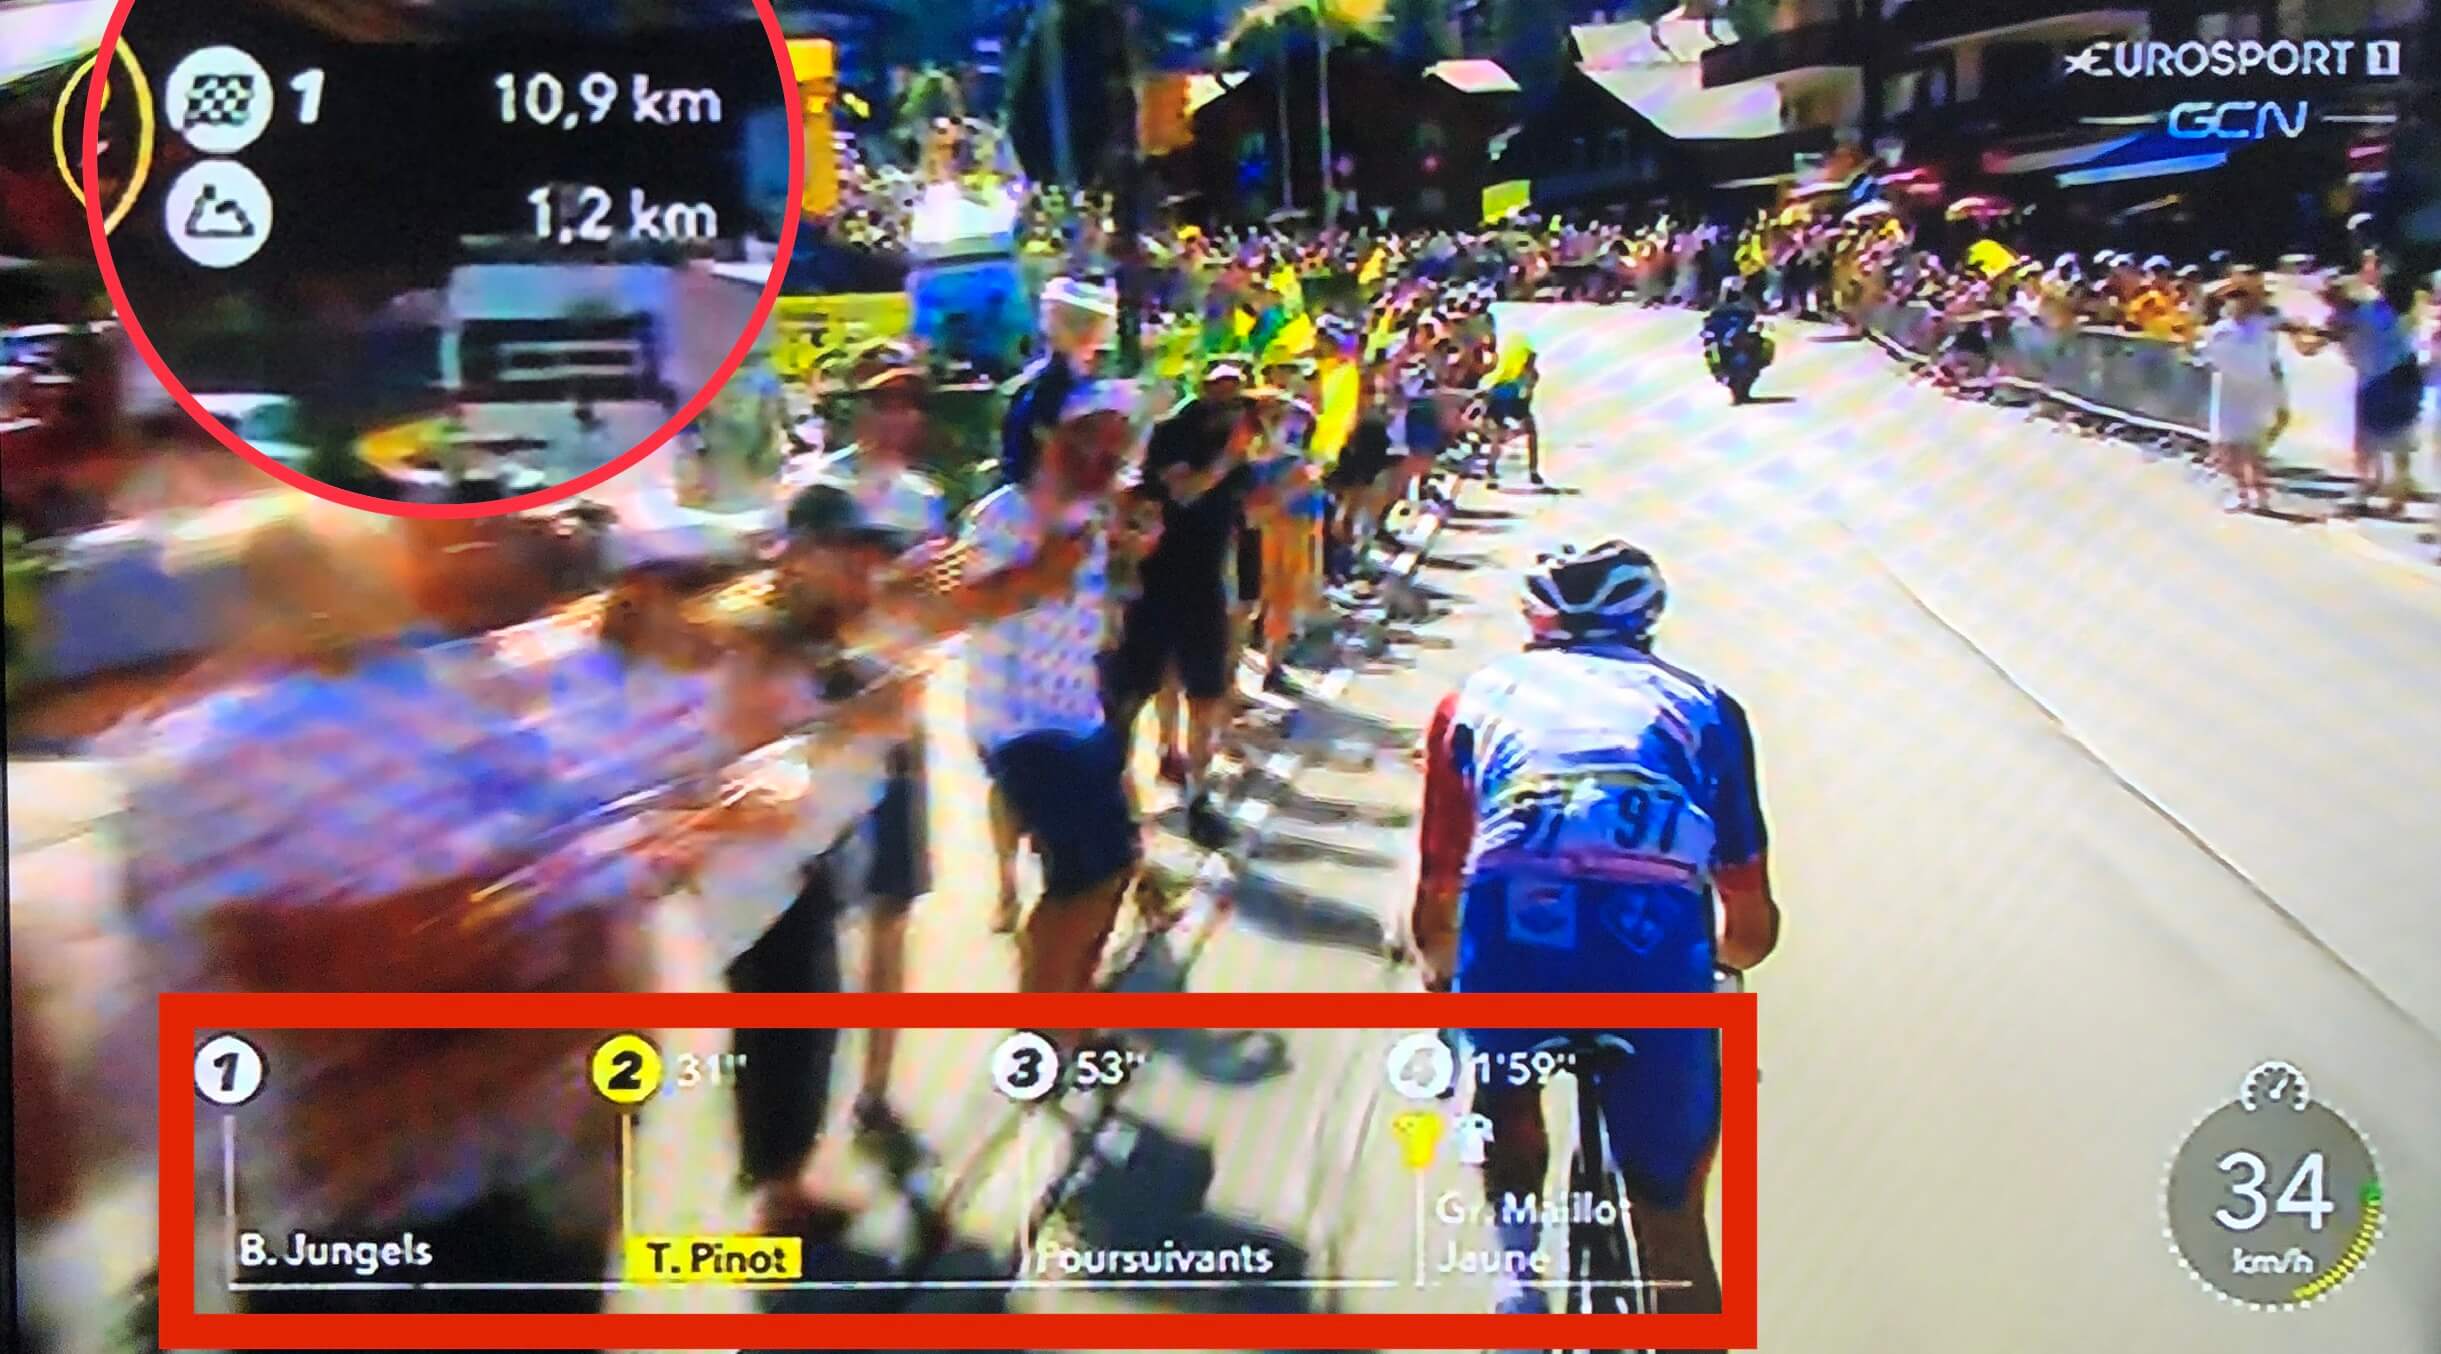
Like football, this makes sense. It illustrates the state of play and our armchair analysis of the race.
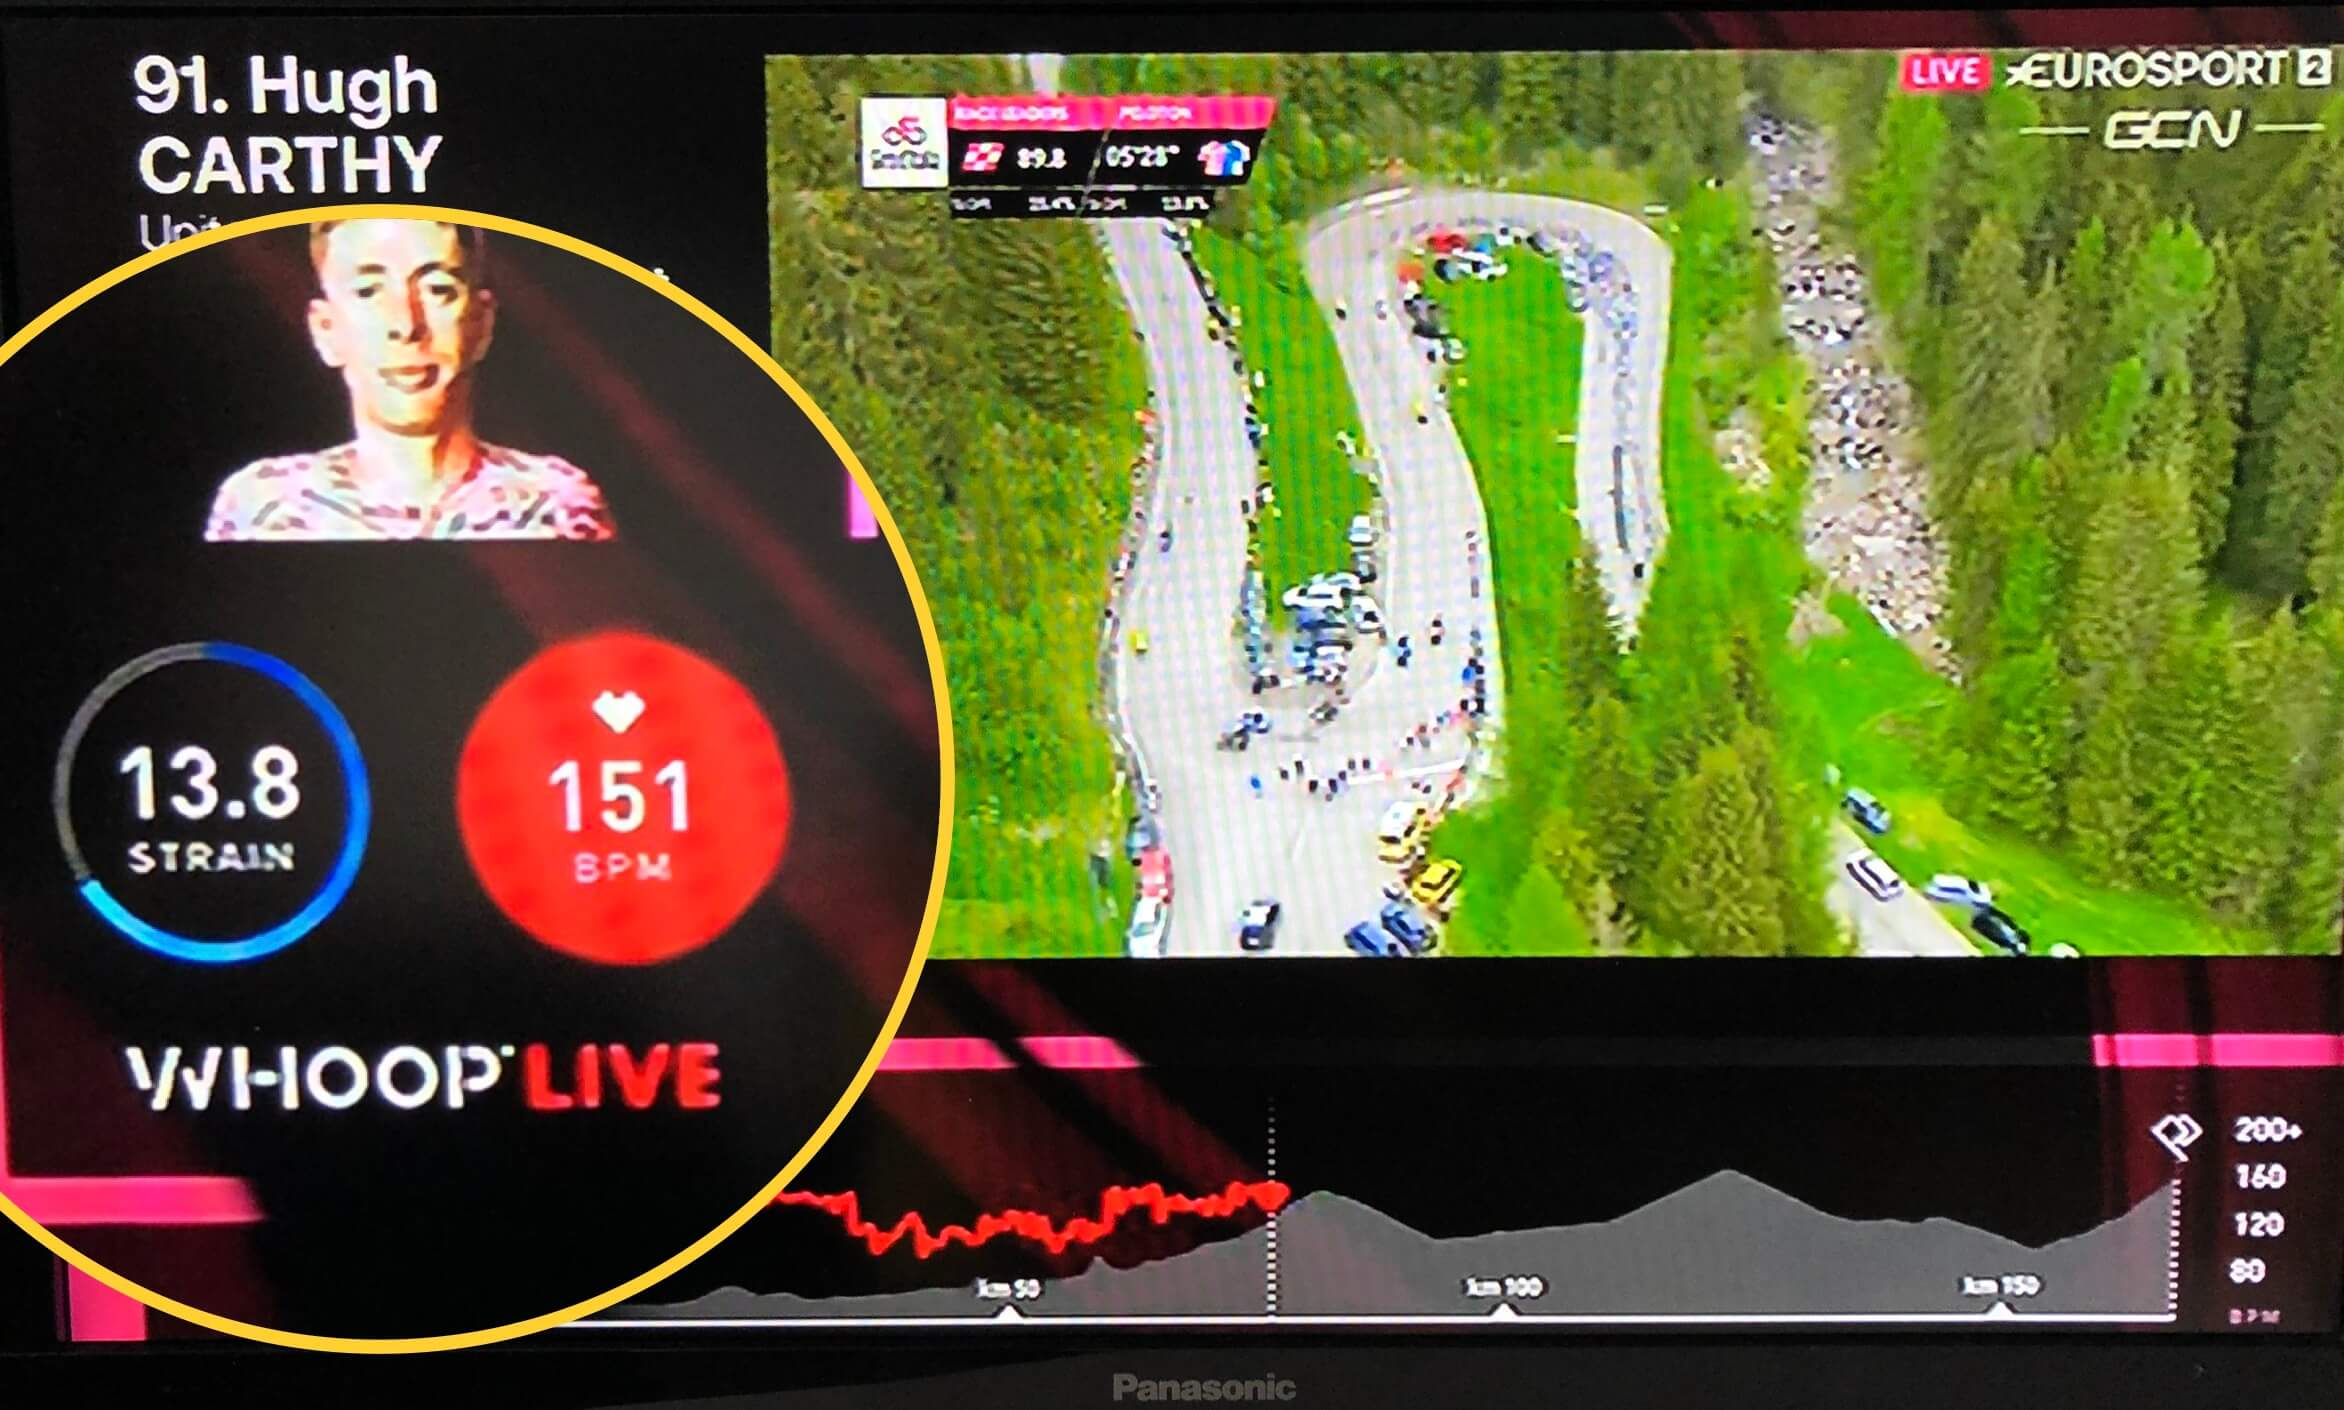
But other data is creeping in that is less easy to comprehend. During the 2022 Giro d’Italia a regular stat illustrated was the “strain index” of riders.
Let the strain be a pain?
What is the strain index?
Despite my watching cycling for many years, I cannot tell you what it is. From the illustration used by the broadcaster it seems to be related to - but not the same as - heart rate.
But if a professional cyclist pushing them self to their physical limit on a mountain stage, in the lead up to a sprint or trying to keep off the chasing bunch a high heart rate should be expected. Does the “strain index” add anything? Apart from enabling the armchair expert, without more detailed explanation it isn’t the same as the football stats.
It might mean something to the experts and be blogged about with varying degrees of accuracy by partially informed enthusiasts but for many they will be simply baffled.
Real time data has a particular audience.
Why use real time data?
The availability of real time data is growing by the day. That isn’t the same as having access to reliable and meaningful timely data. “Im drowning in data” is a problem I hear from many clients.
Real time data can be invaluable for understanding the current state of play: the position something is in and the progress that still needs to be made.
But it can only do this if it is used effectively and selectively.
So what do you need to make sense of that constant stream?
Why use real time data?
It boils down to 3 important questions.
- What do we need to know? And importantly why do you need to know it? What will you do with the information and what insights will it provide? If you can’t answer those, is it worth trying to find out?
- What metrics provide evidence of this? Are there things that already measure what you need to know? How accessible are they? Or do you need to find a way of measuring it yourself?
- Is it understood by you and your wider audience? Do you understand what it tells you and, importantly, can you explain in one sentence using plain English?
Real time data is a resource that offers so much from immediate insight to befuddlement and even apocalyptic horror. Taking a moment to asses when, how and what to use can ensure you draw out as many benefits without straining the index too far.
You may also be interested in

Thought, inspiration and how-to straight in your inbox - Sign up today
By subscribing you will receive our newsletter up to 4 times a year and occasional news of forthcoming events. You can unsubscribe at anytime.